Chart with Dynamic Series
This document describes how to create a report with a Chart control bound to data, so that all series are auto-created based on a common template, data table.
Note that in this scenario, the view type and certain other settings will be the same for all series.
To adjust a Chart with automatically created series, do the following.
-
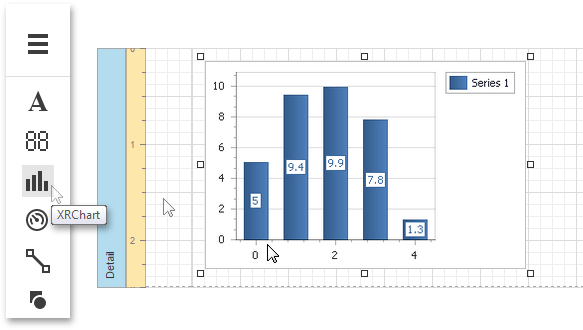
Drop the Chart control from the Toolbox onto the report's Detail band.
-
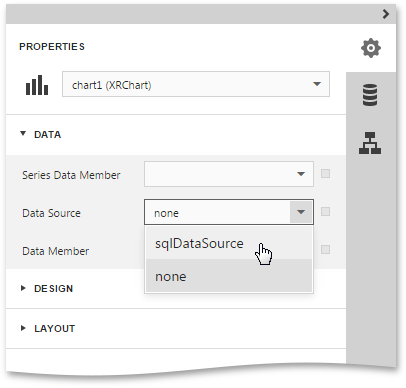
To bind the Chart to a data source, in the Properties Panel, Data category and specify the Data Source property.
 Note
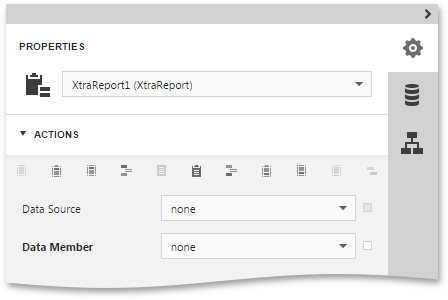
NoteSince you have placed the Chart in the Detail band, the report's Data Source property should be set to None.
-
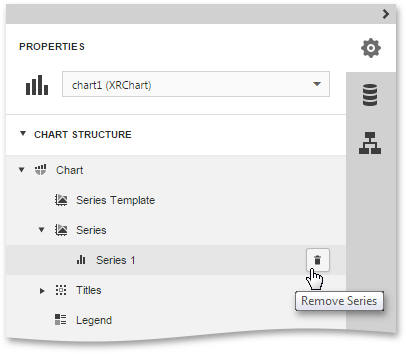
When the chart is added to the report, a new static series is created automatically. To remove this series, in the Chart Structure category, expand the Chart node and then expand the Series item. Next, select this static series and click the Remove Series button for the series.
-
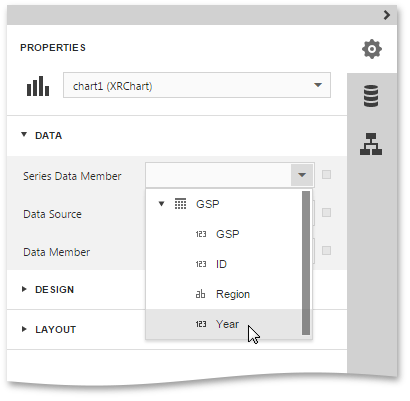
Now, to specify the data field that should provide data for the series names (so that a new series is created for each record in that data field), set the Series Data Member property value.
-
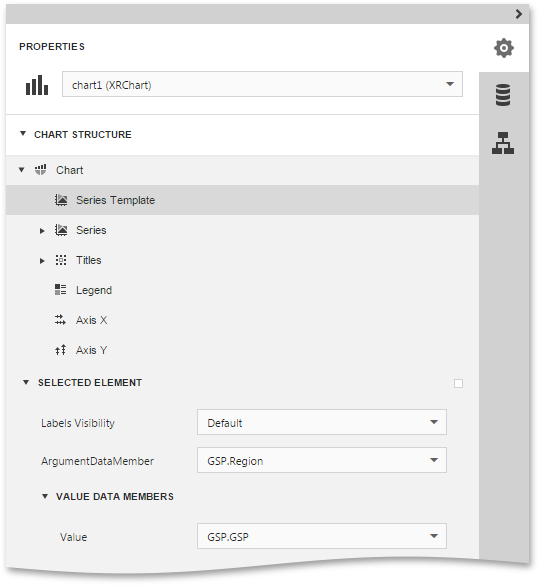
To adjust the series template, in the Chart node, select the Series Template item. Set the Argument Data Member specifying from where the data for point arguments is obtained. Then, specify the Value Data Members property, indicating the data field(s) from which the point values are obtained.
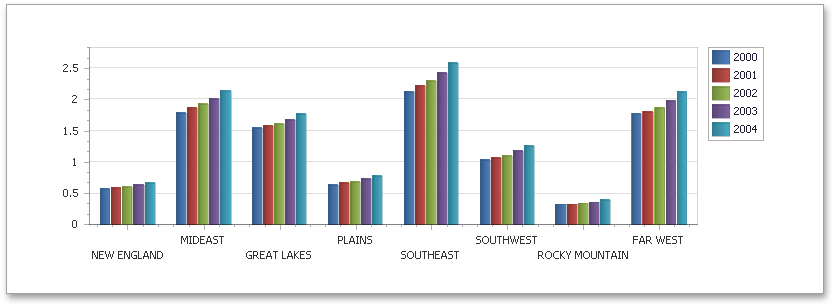
At this point, the chart's data options are completely defined. If required, it is possible to customize many other properties for the Chart, which are not described here.
The chart is now ready. Switch your report to the Preview mode and view the result.
Create powerful mobile forms for your business in minutes