Data Presentation Basics
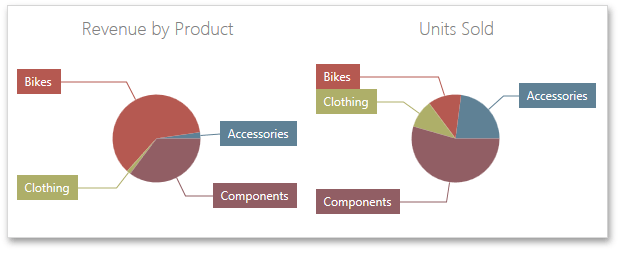
The Pie dashboard item displays a series of pies or donuts that represent the contribution of each value to a total.
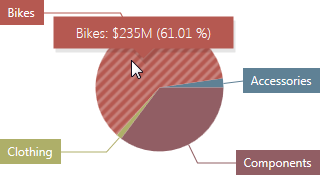
Tooltip
A Pie dashboard item can display a tooltip that shows information about the hovered pie segment.
Create powerful mobile forms for your business in minutes

Copyright © 2026 Mobile Data Anywhere Pty Ltd | All Rights Reserved | Terms of Service | Privacy Policy