Coloring
Certain dashboard items provide the capability to color dashboard item elements by associating dimension values/measures and specified colors. You can choose whether to use a global color scheme to provide consistent colors for identical values or specify a local color scheme for each dashboard item. To learn more about coloring concepts common for all dashboard items, see the Coloring section.
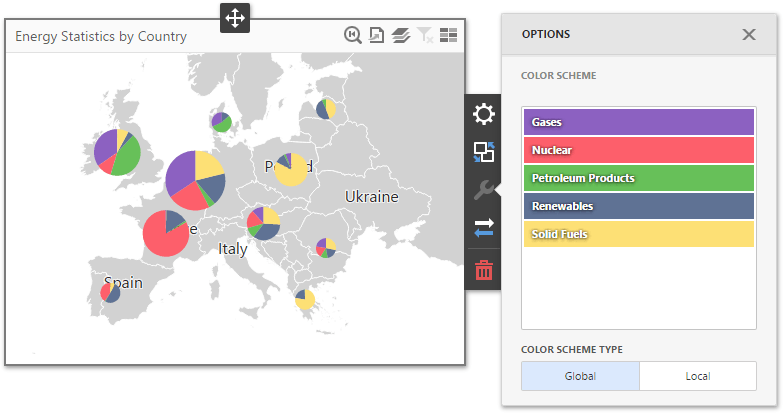
The Pie Map dashboard item allows you to manage the coloring of segments corresponding to various dimension values/measures. For example, the image below illustrates the Pie Map dashboard item with a custom color palette.
Create powerful mobile forms for your business in minutes