Data Presentation Basics
The Grid displays data in a two-dimensional table that supports four types of columns.
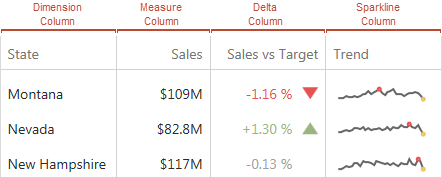
- The dimension column displays values from the bound data item "as is".
- The measure column displays summaries calculated from data in the bound data item.
- The delta column,
- The sparkline column visualizes the variation of summary values over time.
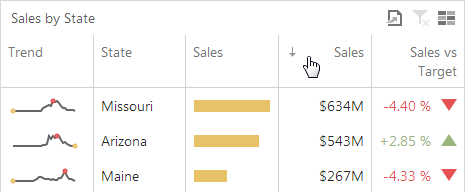
Sort Grid Rows
To sort records by a column's values and replace the existing sort conditions applied to the current or other columns, click the target column's header until the Up or Down arrow icon is displayed within the header. The Up and Down arrows indicate ascending and descending sort orders, respectively.
You can also apply the required sort condition by right-clicking a column header and selecting Sort Ascending or Sort Descending from the invoked context menu.
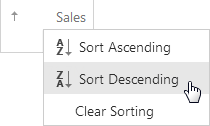
To remove sorting by a column, select Clear Sorting from the context menu or click a column header while holding down the CTRL key.
Tooltips
A Grid dashboard item can display a tooltip when the mouse pointer is hovered over the bar in the measure column.
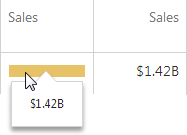
The tooltip shows the value in the measure column as text.
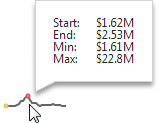
When the mouse pointer is hovered over the cell in the sparkline column, the tooltip can display start/end values and minimum/maximum values.
Create powerful mobile forms for your business in minutes