Data Presentation Basics
The Dashboard supports three types of Geo Point maps.
-
The
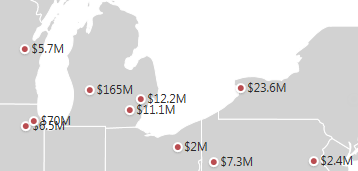
Geo Point Map
dashboard item places callouts on the map using geographical coordinates.
-
The
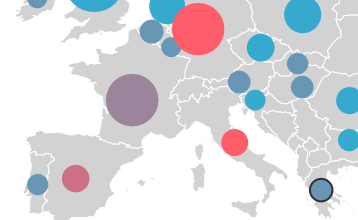
Bubble Map
dashboard item displays bubbles on the map. The color and size of each bubble relay data particular to that color and size.
-
The
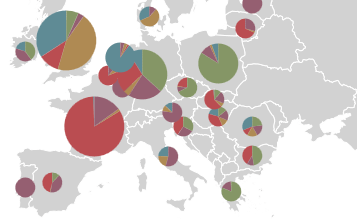
Pie Map
dashboard item displays pies on the map. Each pie shows the relative contribution that different values contribute to the total.
You can switch between the provided values using the Values button (the
 icon) in the map's
caption.
icon) in the map's
caption.
Map Zooming and Scrolling
Use the following actions to scroll a map.
|
Operation |
Mouse |
Touch |
|---|---|---|
| Zooming | Use the mouse scroll wheel to change the current zoom level for the map. |
On a touchscreen device, use pinch or spread gestures to change the current zoom level.

|
| Scrolling | To scroll the map, hold down the left mouse button and drag it. |
On a touchscreen device, use flick gestures to scroll the map.

|
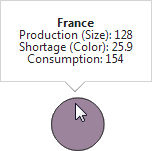
Tooltip
A Geo Point Map dashboard item can display a tooltip that displays information in a hovered callout/bubble/pie.
Create powerful mobile forms for your business in minutes