Data Presentation Basics
The Gauge dashboard item displays a series of gauges. Each gauge can communicate two values - one with a needle and the other with a marker on the scale.
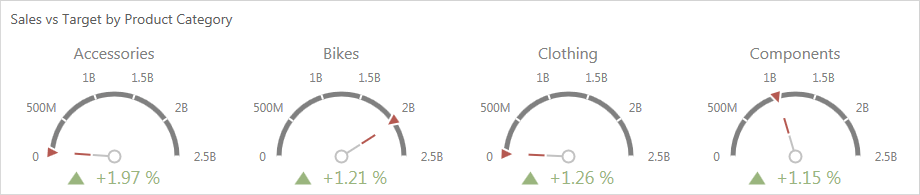
The
Gauge
dashboard item can illustrate this difference for various sets of values. You can switch between these sets using the
Values
button (the
 icon) in the gauge's
caption.
icon) in the gauge's
caption.
Create powerful mobile forms for your business in minutes
Copyright © 2026 Mobile Data Anywhere Pty Ltd | All Rights Reserved | Terms of Service | Privacy Policy