Interactivity
To enable interaction between the Scatter Chart and other dashboard items, you can use the interactivity features, as Master Filtering and Drill-Down.
Master Filtering
The Web Dashboard allows you to use any data aware dashboard item as a filter for other dashboard items. To learn more about filtering concepts common to all dashboard items, see the Master Filtering topic.
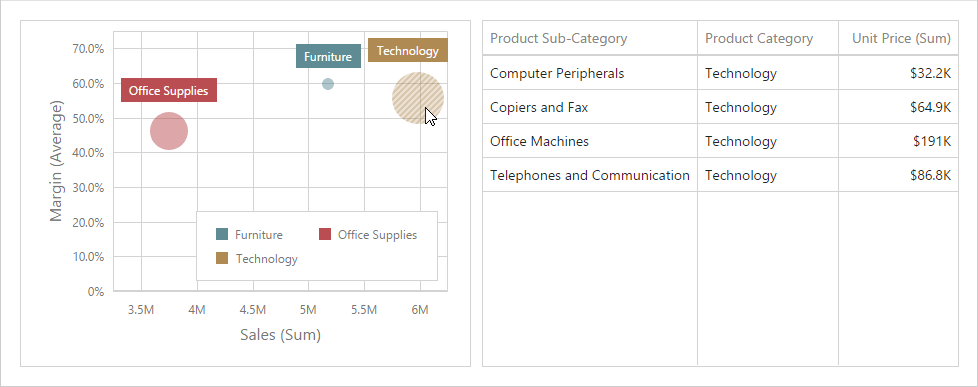
The Scatter Chart dashboard item supports filtering by points that correspond to specific argument values or their combinations.
When Master Filtering is enabled, you can click a point (or multiple points) to make other dashboard items only display data related to the selected point(s).
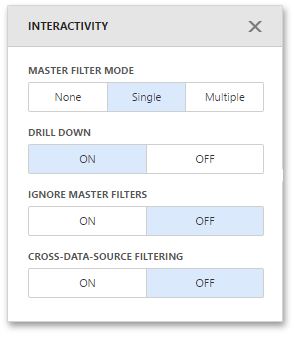
To enable Master Filtering, Interactivity menu and select the required Master Filtering mode.
To reset filtering, use the
Clear Master Filter
button (the
 icon) in the Scatter Chart's
caption.
icon) in the Scatter Chart's
caption.
Drill-Down
The Drill-Down feature allows you to change the detail level of data displayed in dashboard items. To learn more about concepts common to all dashboard items, see the Drill-Down topic.
When drill-down is enabled, you can click a point to view the details (or double-click a point in case of enabled Master Filtering).
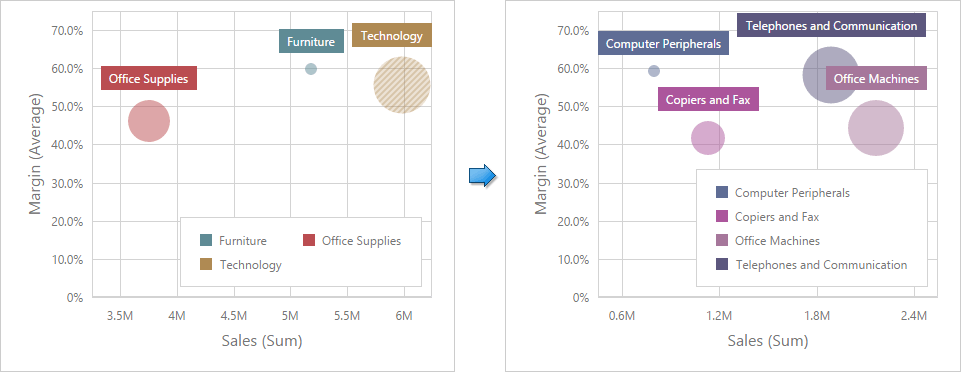
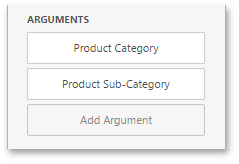
Drill-down requires that the Arguments section contains several dimensions, from the least to the most detailed dimension.
In OLAP mode, you can perform drill-down for either a hierarchy data item or several dimension attributes.
To enable Drill-Down, Interactivity menu and turn the Drill-Down option on.
To return to the previous detail level, click the
Drill Up
button (the
 icon) in the Scatter Chart's
caption.
icon) in the Scatter Chart's
caption.
Create powerful mobile forms for your business in minutes