Series
The Chart dashboard item supports different types of series - from simple bar and line charts to candle stick and bubble graphs.
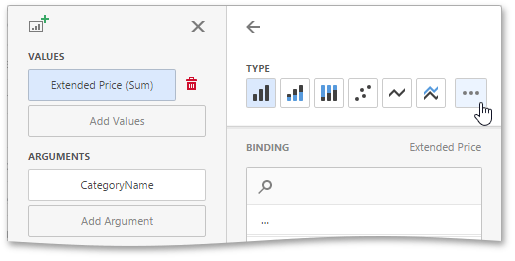
Change Series Type
By default, Chart visualizes data using the Bar series. To switch between series types, click the required data item in the Values section and select the required series type in the invoked data item menu.
Configure Series Options
To configure common series options, go to the data items Options section.
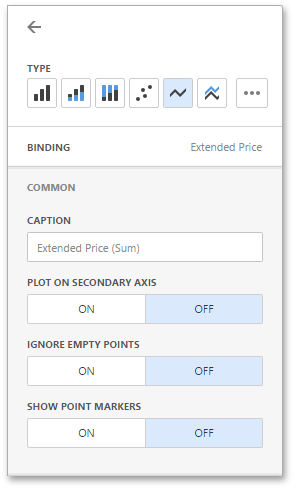
Here you can specify whether or not to plot the current series on the secondary axis, configure point markers behavior, etc.
The following options are available.
|
Option |
Description |
|---|---|
| Caption | Specifies the series caption. |
| Plot on secondary axis | Specifies whether or not the secondary axis is used to plot the current series. |
| Ignore empty points | Specifies whether or not empty points are ignored when plotting the current series. |
| Show point markers |
Specifies whether or not to show point markers for the current series. This option is in effect for the
Line
and
Area
series.
Note
Note that point markers are always shown when Master Filtering is enabled for the Chart dashboard item. |
Configure Series Point Label
The Point Label section of a value data item allows you to enable series point labels and manage their settings.
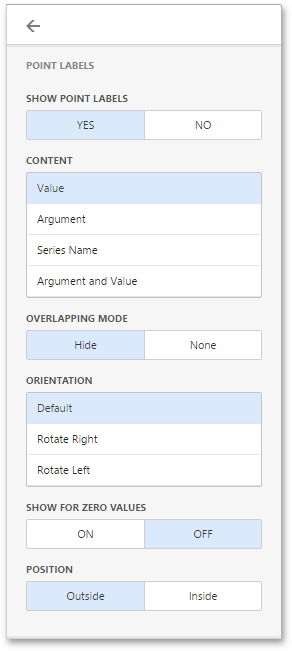
For example, you can specify whether or not to show point labels or set the label overlap mode.
The following options are available.
|
Option |
Description |
|---|---|
| Show Point Labels | Specifies whether or not to show point labels for the current series. |
| Content | Specifies the type of content displayed within point labels. You can select one of the following options: Value, Argument, Series Name or Argument and Value. |
| Overlapping Mode | Specifies the label overlap mode. You can reposition or hide overlapping labels or disable a resolving algorithm. |
| Orientation | Specifies the orientation of point labels. You can set default orientation or rotate point labels 90 degrees clockwise or counter clockwise. |
Bar series has additional settings.
|
Option |
Description |
|---|---|
| Show for zero values | Specifies whether or not to show labels for points with zero values. |
| Position | Specifies the position of point labels relative to bars. Point labels can be displayed inside or outside bars. |
Create powerful mobile forms for your business in minutes