Providing Data
The Web Dashboard allows you to bind various dashboard items to data in a virtually uniform manner. To learn more, see the Binding Dashboard Items to Data topic.
The only difference is in the data sections that the required dashboard item has. This topic describes how to bind a Card dashboard item to data.
Binding to Data in the Web Dashboard
The image below shows a sample Card dashboard item that is bound to data.
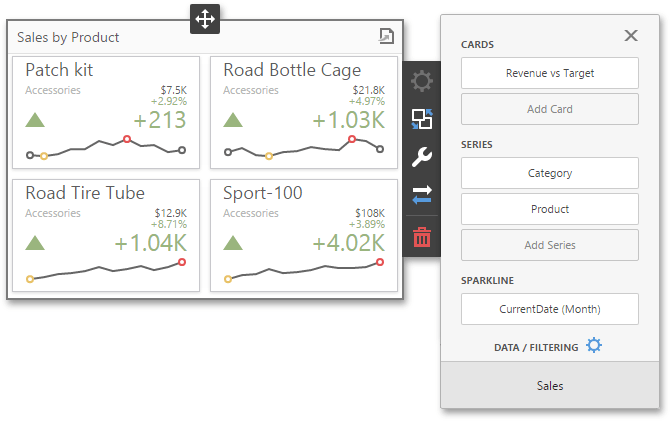
To bind the Card dashboard item to data, click a placeholder contained in one of the available data sections and select the required data source field in the Binding section of the invoked data item menu.
The table below lists and describes the Card's data sections.
|
Section |
Processed as |
Description |
|---|---|---|
| Cards | Measure (both Actual and Target values) |
Contains data items used to calculate values displayed within cards. After you add the data item containing
actual
data, you can add the second data item (optional) that contains
target
data. If both items are provided, cards show the difference between actual and target values, called
delta.
Delta.
You can fill several data item containers in the Cards section and use the
Values
drop-down menu to switch between the provided values. To invoke the Values menu, click the
|
| Series | Dimension | Contains data items whose values are used to label cards. |
| Sparkline | Dimension | Provides a date-time dimension whose data will be used to visualize values using sparklines. |
 icon in the dashboard item caption.
Create powerful mobile forms for your business in minutes