Providing Data
The Web Dashboard allows you to bind various dashboard items to data in a virtually uniform manner.
The only difference is in the data sections that the required dashboard item has. This topic describes how to bind the Bubble Map dashboard item to data.
Binding to Data in the Web Dashboard
The image below shows a sample Bubble Map dashboard item that is bound to data.
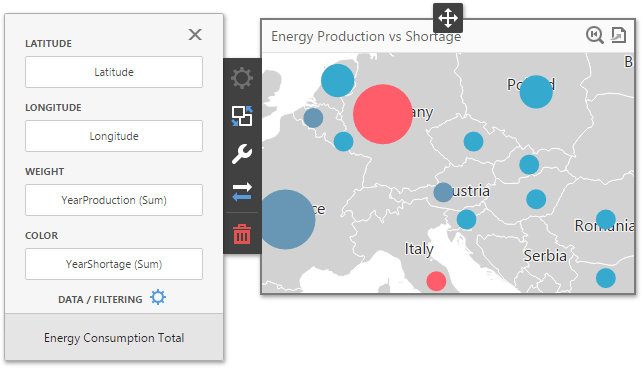
To bind the Bubble Map dashboard item to data, click a placeholder contained in one of the available data sections and select the required data source field in the Binding section of the invoked data item menu.
The tables below list and describes Bubble Map data sections.
|
Section |
Processed as |
Description |
|---|---|---|
| Lattitude | Dimension | Accepts a dimension used to provide geographic latitude. |
| Longitude | Dimension | Accepts a dimension used to provide geographic longitude. |
| Weight | Measure | Accepts a measure used to evaluate the bubble's weight. |
| Color | Measure | Accepts a measure used to evaluate the bubble's color. |
The Bubble Map allows you to add supplementary content to the tooltips to provide additional data.
|
Section |
Processed as |
Description |
|---|---|---|
| Tooltip Dimensions | Dimension | Accepts dimensions allowing you to add supplementary content to the tooltips. |
| Tooltip Measures | Measure | Accepts measures allowing you to add summaries to the tooltips. |
Create powerful mobile forms for your business in minutes