Axes
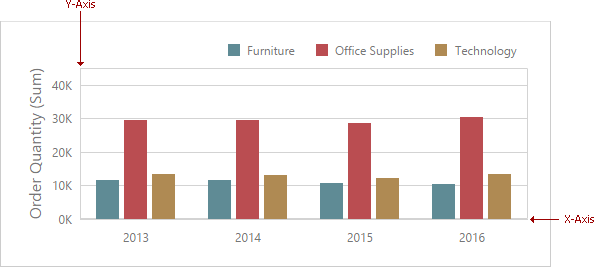
The Chart dashboard item displays two axes by default: the X-axis and the Y-axis. The X-axis is the axis of arguments and the Y-axis is the numerical axis of values.
Axis X
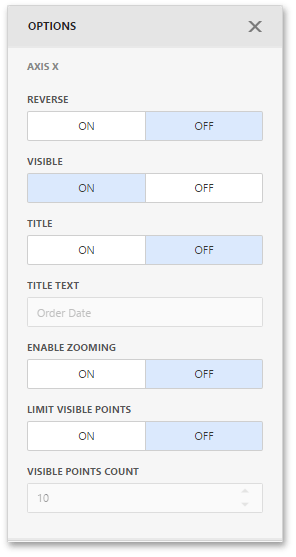
To access X-axis settings, go to the Chart's Options menu and open the Axis X section.
You can configure the following settings.
|
|
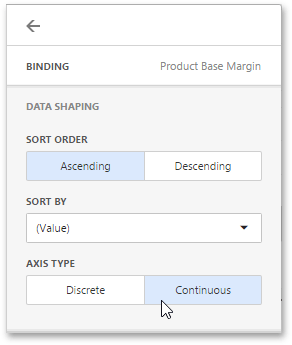
Continuous and Discrete X-Axes
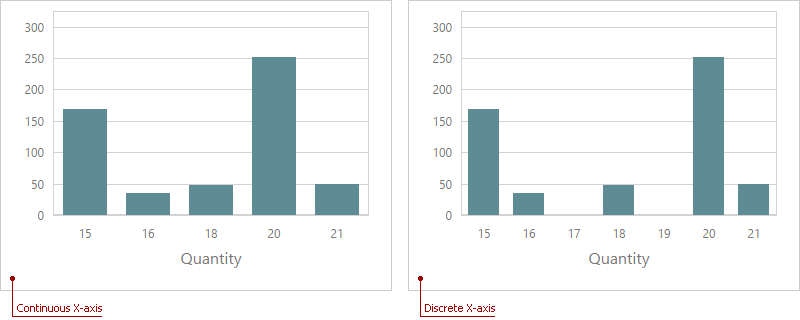
If the dimension in the Arguments section contains numeric data, the Chart can create either a continuous X-axis or a discrete X-axis.
If a continuous axis is used, the distance between argument values is proportional to their values. On a discrete axis, all argument values are an equal distance from each other.
To specify the X-axis type in the Web Dashboard, go to the data item Data Shaping menu for the argument dimension and select the axis type. The image below illustrates how to change this setting for the Product Base Margin data item.
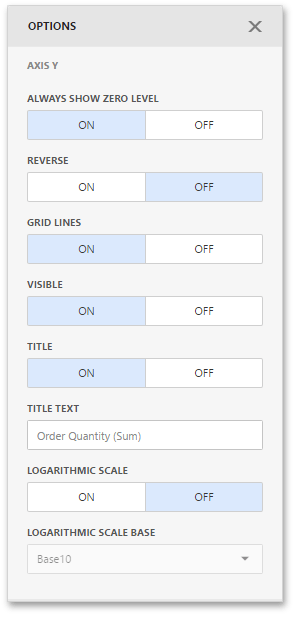
Axis Y
To access Y-axis settings, go to the Chart's Options menu and open the Axis Y section for a corresponding pane.
|
|
Secondary Axis
The secondary Y-axis is useful when it is necessary to visually combine several charts into one. Secondary axes provide the ability to plot series with different ranges on the same chart.
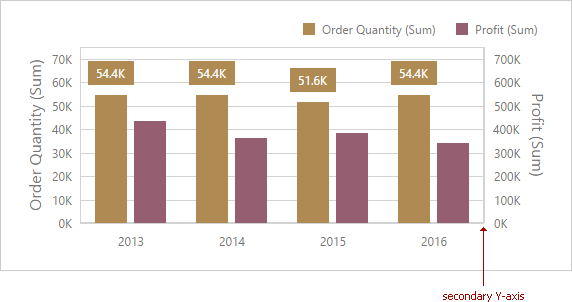
To plot the required series using the secondary axis, go to the data item Options menu for the value measure and turn the Plot on Secondary Axis option on.
Create powerful mobile forms for your business in minutes